
CurlyWhirly
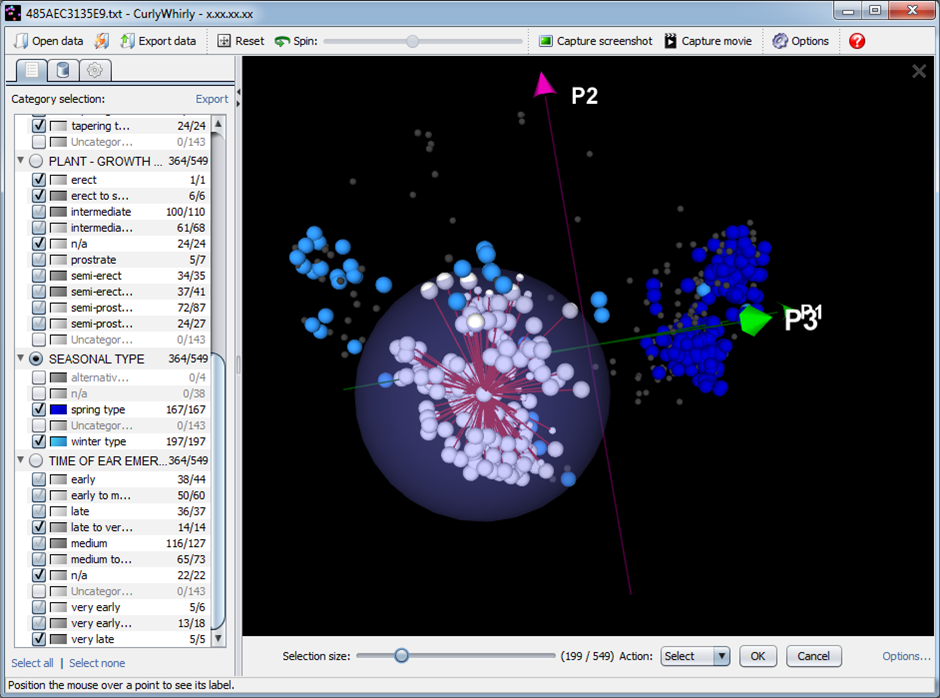
CurlyWhirly is designed for the visualization of 3D data provided as Cartesian coordinate data and is particularly well suited for visualizing the outputs of analyses such as Multidimensional Scaling and Principal Coordinates Analysis. It comfortably handles large-scale genetic diversity data with plots containing tens of thousands of data points on relatively modest hardware. To explore datasets in detail, a comprehensive hierarchical categorization and filtering system allows for fine-grained filtering and selection of data points.
Visit the download page to get the latest version of CurlyWhirly 1.21.08.16 (16th August 2021).
CurlyWhirly features:
- 3D display of multi-dimensional data.
- Rotate the graph by dragging on the display.
- Zoom in and out of the data set.
- Automatic rotation.
- Filtering of coloured data points by selecting/de-selecting categories.
You can get a full list of recent new additions, changes or bug fixes by reading through the release notes.