GO Analysis and Annotation
GO annotations for the BaRT dataset is available in a spreadsheet BaRTv1_0_GO_annotation_withLookup.xlsx . In addition, this file contains a sheet where you can paste your own lists of BaRT gene IDs and it will look up their annotation in the sheet with the GO data:
- 1. Copy and paste a column with gene IDS from the padded BaRT version into column 1 of the sheet named "lookup"
- 2. Row 2 contains the formulas that do the lookup and results should appear in this row immediately (columns B-F)
- 3. To generate the results for the remaining rows, select fields B2 to F2, then double-click the little green square at the bottom right of the selection outline. This should auto-fill all the fields below and generate the lookup results
External GO enrichment analysis with BaRT
- 1. Go the gProfiler page at https://biit.cs.ut.ee/gprofiler/gost
- 2. Copy and paste a list of BaRT gene identifiers (one per line) into the query input box
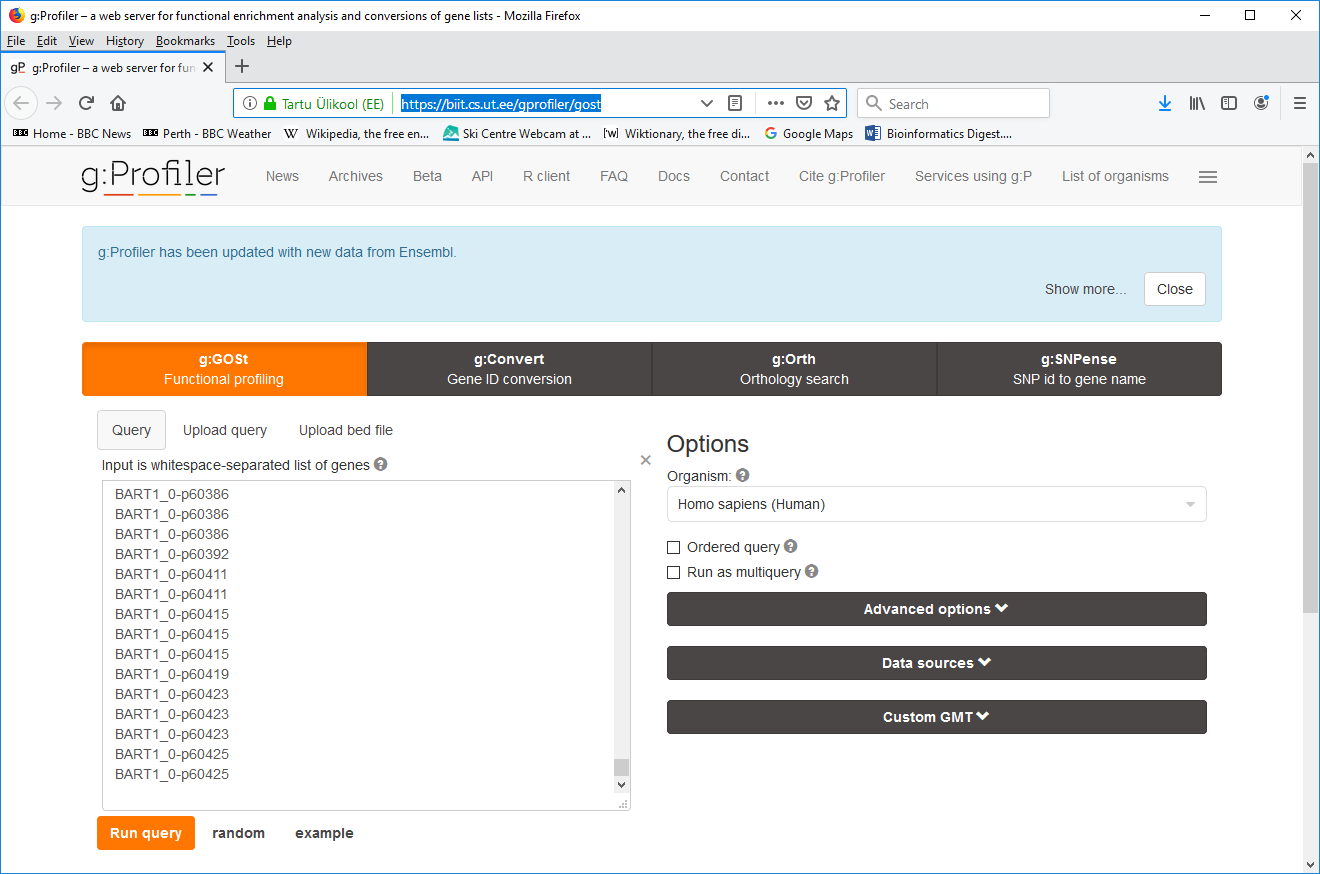
- 3. Expand the Custom GMT field at the bottom right and select the BaRT GMT file (download the BaRT_v_1_0.gmt file) from your local file system. The file will then get uploaded to the web server.
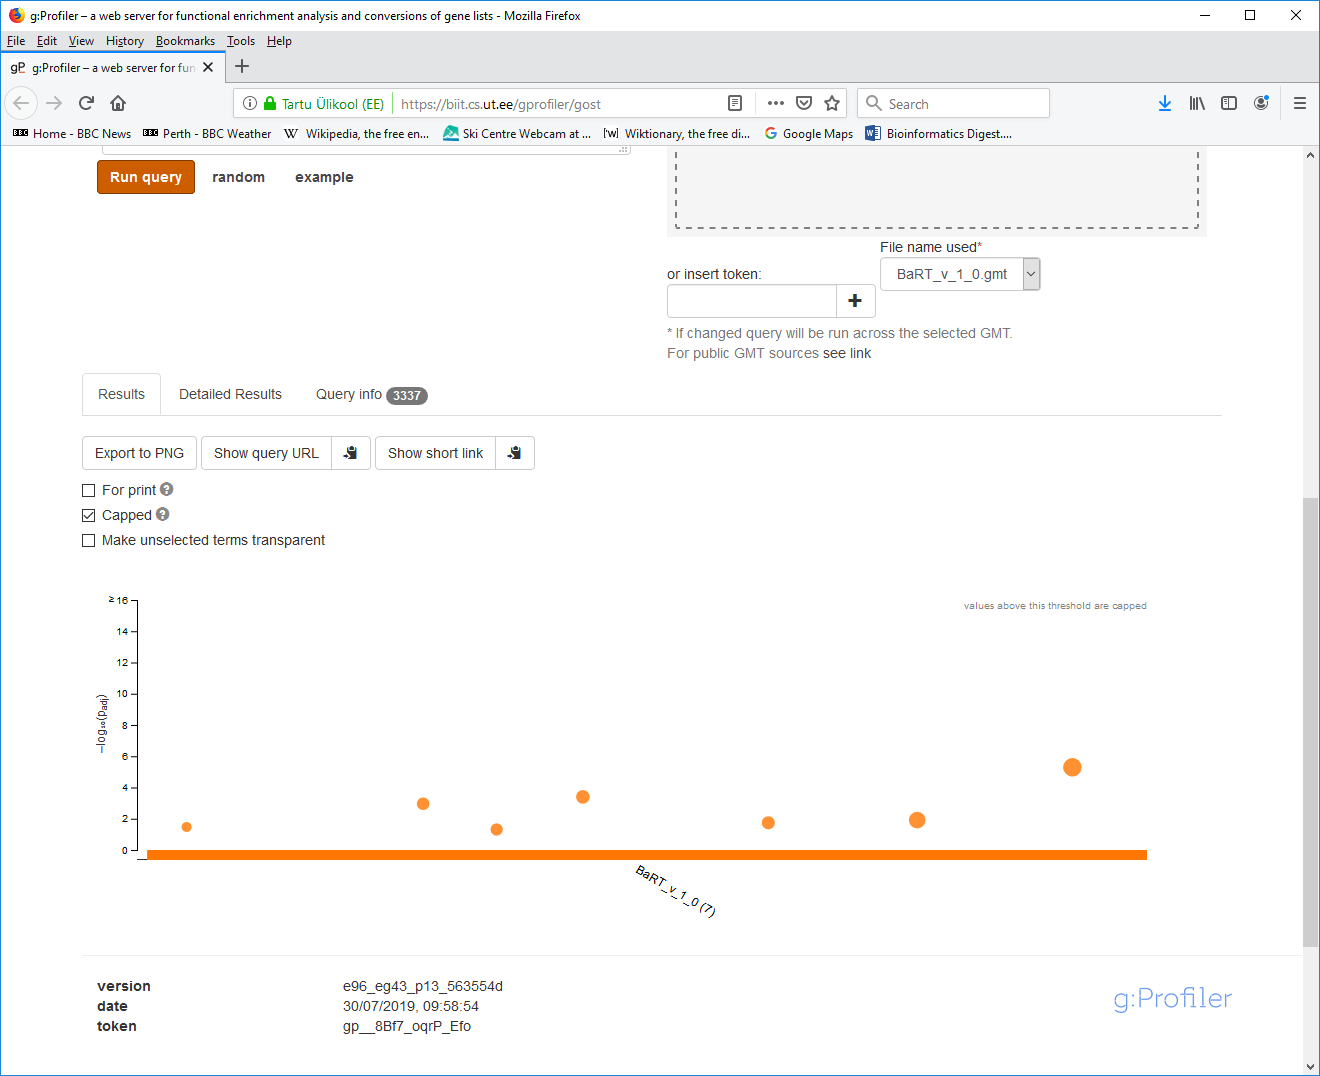
- 4. Click "Run query".
- 5. Your results will appear below after a few seconds. The interactive graph itself is quite informative:
- 6. Click the "Detailed Results" tab:
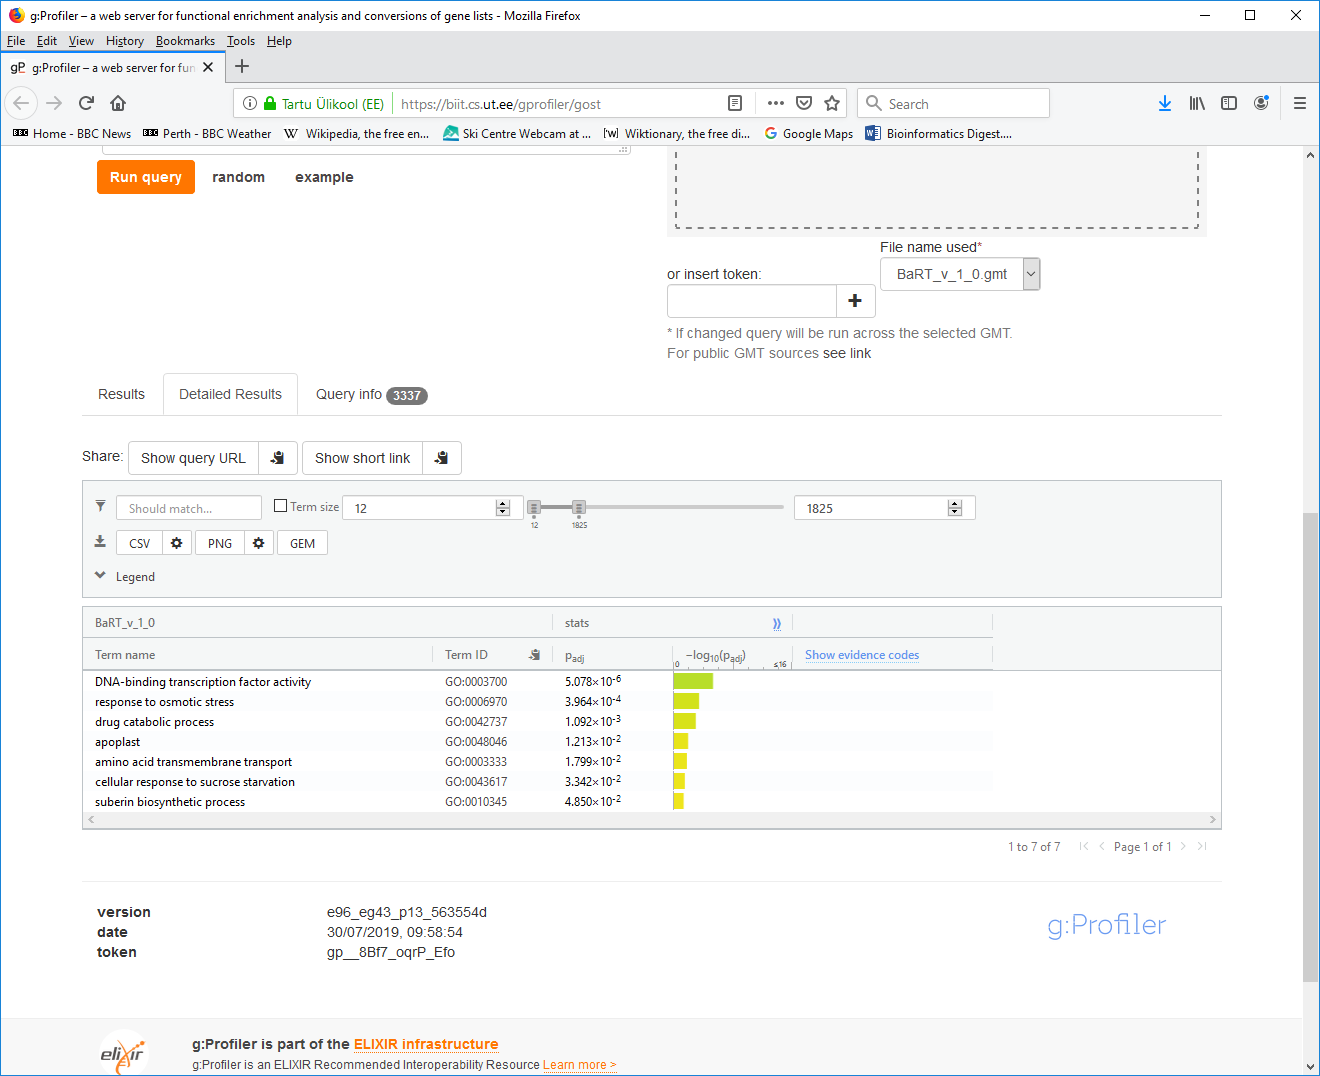
- 7. Click the "CSV" button to download your results file and save it to your local disk.