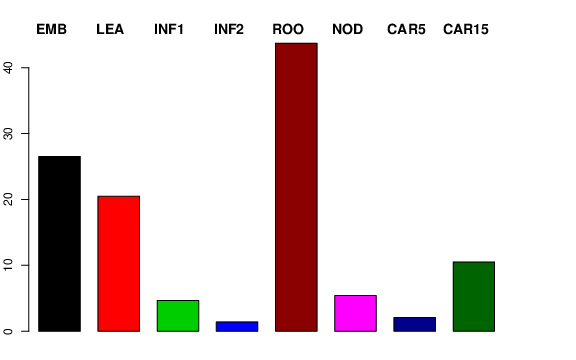
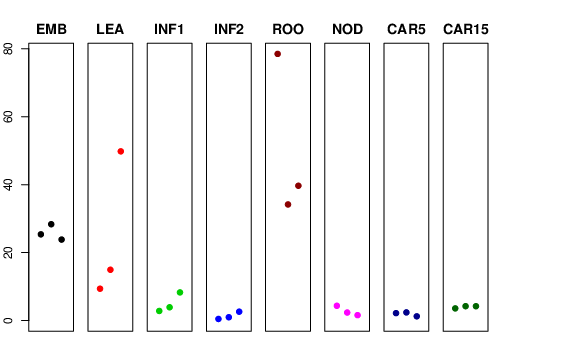
MLOC_1690 FPKM values
| FPKM by Treatment | FPKM by Replicate |
|---|
| 
|
| Treatment ID | Treatment Description | Rep 1 FPKM | Rep 2 FPKM | Rep 3 FPKM | Treatment FPKM |
|---|
| EMB | 4-day embryos dissected from germinating grains | 25.3654 | 28.3418 | 23.8266 | 26.5184 |
| LEA | Shoots from the seedlings (10 cm shoot stage) | 9.36461 | 14.9413 | 49.7962 | 20.4717 |
| INF1 | Young developing inflorescences (5mm) | 2.80963 | 3.89337 | 8.27148 | 4.67138 |
| INF2 | Developing inflorescences (1-1.5 cm) | 0.465987 | 0.959347 | 2.60131 | 1.40632 |
| ROO | Roots from the seedlings (10 cm shoot stage) | 78.4816 | 34.1631 | 39.6726 | 43.7107 |
| NOD | Developing tillers at six leaf stage, 3rd internode | 4.33392 | 2.35207 | 1.57543 | 5.3966 |
| CAR5 | Developing grain, bracts removed (5 DPA) | 2.16607 | 2.38754 | 1.23145 | 2.07192 |
| CAR15 | Developing grain, bracts removed (15 DPA) | 3.56617 | 4.21444 | 4.20634 | 10.4976 |
CDS Structure of MLOC_1690

Members of Gene Cluster
This cluster has a confidence assignment of
High Confidence.
The gene has a transcript that is part of a cluster represented by
MLOC_1690.1
Homology of Longest Transcript to Model Species (BLASTX to E-value < 1e-50)
| Database | Hit | Frame | E-value | Score | % Identity | Description |
|---|
| Rice PP6 |
LOC_Os10g38740.1 |
+2 |
4e-109 |
327 |
184/225 (82%) |
13110.m03529 protein glutathione S-transferase, putative, expressed |
| TAIR PP10 |
AT1G10370.1 |
+2 |
9e-60 |
198 |
102/208 (49%) |
| Symbols: GST30, ATGSTU17, GST30B, ERD9 | Glutathione S-transferase family protein | chr1:3397274-3398273 REVERSE LENGTH=227 |